State of Student Aid in Texas – 2022

College Graduates Earn Far More Than High School Graduates and Experience Less Unemployment

The U.S. Census Bureau reports that higher levels of education are typically associated with higher median earnings; however, annual incomes in the U.S. also vary widely within the same level of education. Consequently, some workers with associate degrees earn more than those with bachelor’s degrees, while other bachelor’s-level graduates make more than some master’s degree holders. While educational level is not the sole predictor of one’s income, the income range also expands as level of education increases, suggesting that workers with higher levels of education may encounter more opportunities for financial growth.

More evidence for the economic value of education comes from the U.S. Bureau of Labor Statistics. For May 2022, the unemployment rate of workers age 25 and older who had not completed high school stood at 5.2 percent. The unemployment rate for high school graduates was 3.8 percent, while the unemployment rate for those with a bachelor’s degree and higher was 2.0 percent. These rates are lower than the prior two years as the U.S. economy continues to recover from the peak of the COVID-19 pandemic, but the pattern of lower unemployment rates for those with higher education still holds true.

Annual Earnings, Full-Time U.S. Workers: 25th, 50th, and 75th Percentiles (2020)
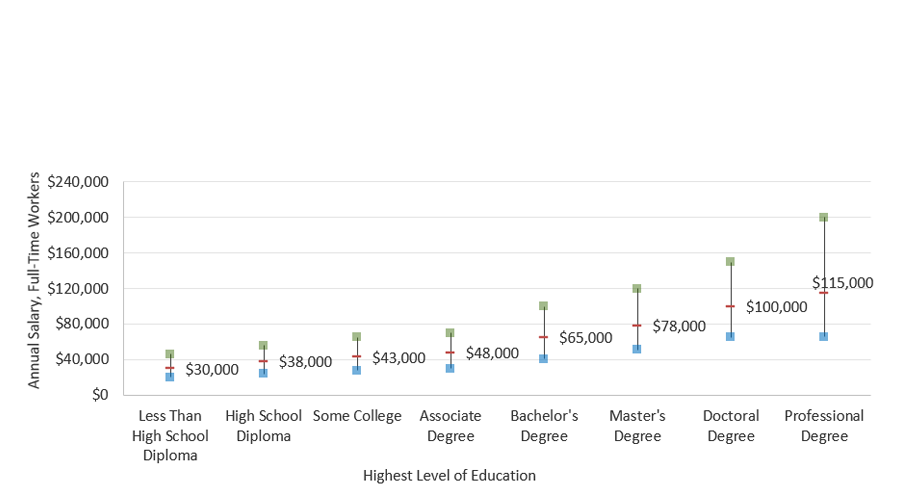
Annual Earnings, Full-Time U.S. Workers: 25th, 50th, and 75th Percentiles (2020)

Unemployment Rate by Educational Attainment (2019 through 2022, Seasonally Adjusted)
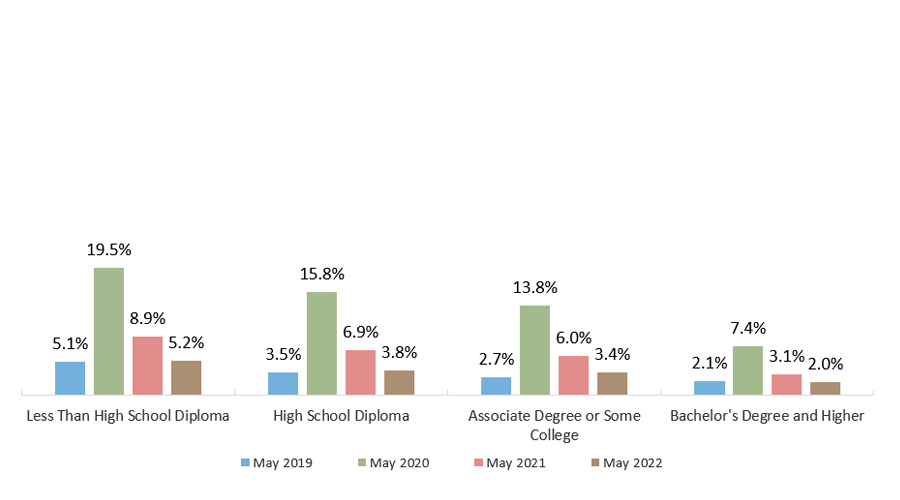
Unemployment Rate by Educational Attainment (2019 through 2022, Seasonally Adjusted)

Sources: Unemployment: Bureau of Labor Statistics. “Employment Status of the Civilian Population 25 Years and Over by Educational Attainment,” May 2022 (http://www.bls.gov/news.release/empsit.t04.htm); Historical Unemployment Rates: Bureau of Labor Statistics. Data Retrieval: Labor Force Statistics (CPS) (https://www.bls.gov/webapps/legacy/cpsatab4.htm); Earnings: U.S. Census Bureau, American Community Survey 2020 (http://www.census.gov/programs-surveys/acs/data/pums.html). 

Better-Educated Workers Have Higher Lifetime Earnings

The difference in the salary earned by higher- and lower-credentialed workers compounds over a lifetime. The estimated earnings during the work-life (approximately 40 years) of a worker who did not complete high school is about $1 million. Completing high school increases median lifetime earnings by about $300,000, and completing a bachelor’s degree raises median lifetime earnings to $2.6 million. Post-graduate education pays off even more; workers with a professional degree, such as doctors and lawyers, can expect over the course of their work-lives to earn an additional $2 million over what workers with a bachelor’s degree will earn. Higher levels of education typically offer increased lifetime earnings, but they also allow for more earning variability, as shown by the wider income ranges for the higher levels of education, suggesting the importance of quality career guidance.

Lifetime Earnings, Full-Time U.S. Workers: 25th, 50th, and 75th Percentiles
(in Millions of 2020 Dollars)
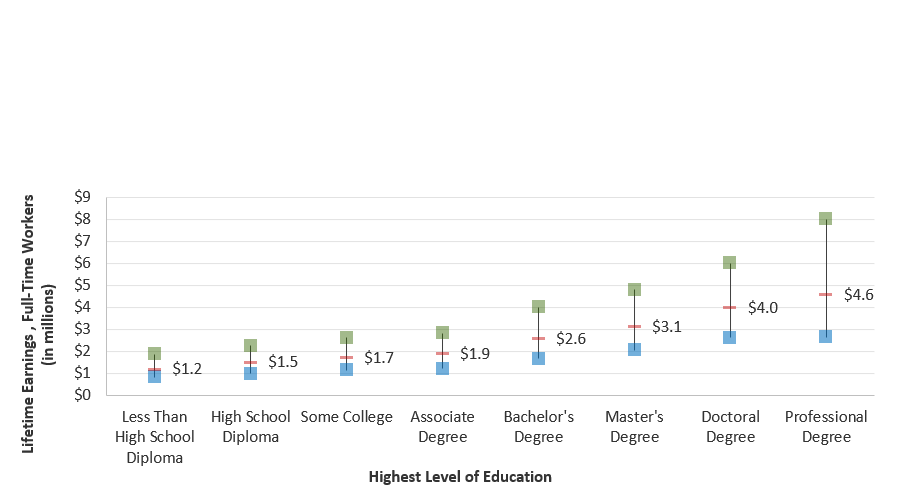
Lifetime Earnings, Full-Time U.S. Workers: 25th, 50th, and 75th Percentiles (in Millions of 2020 Dollars)

Median lifetime earnings differences based on education show earnings gaps by gender. For example, women typically must earn at least a bachelor’s degree to make as much as men with an associate degree.

Median Work-life Earnings of Full-Time U.S. Workers by Level of Education and Gender (in millions of 2020 dollars)
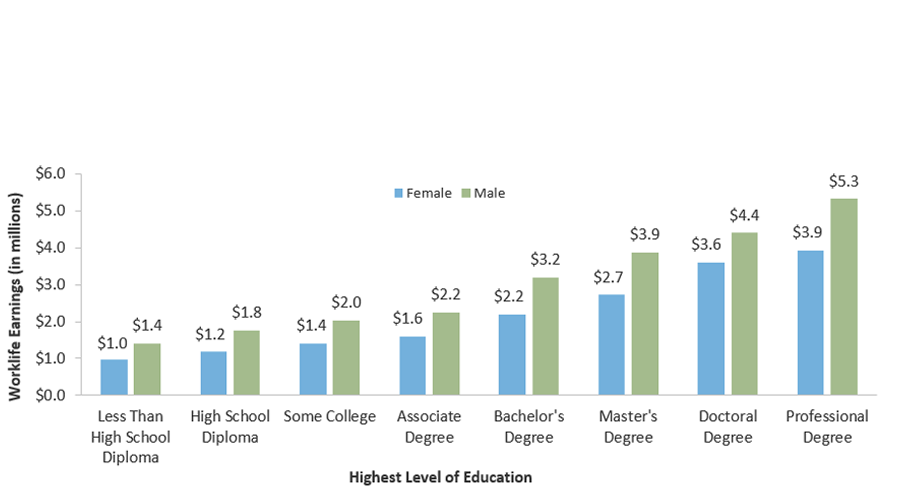
Median Work-life Earnings of Full-Time U.S. Workers by Level of Education and Gender (in millions of 2020 dollars)

Sources: U.S. Census Bureau, American Community Survey 2020 (http://www.census.gov/programs-surveys/acs/data/pums.html).

One-Third of Texans Age 25 and Older Have a Bachelor’s Degree

Texas is slightly lower than the nation in the percentage of people who have completed a bachelor’s degree or higher. U.S. Census Bureau data show that in 2018 about 32 percent of Texans age 25 and older had obtained a bachelor’s degree or higher, compared to 35 percent of adults nationwide. Among the six most populous states, Texas has the lowest percentage of the overall population age 25 and older with a bachelor’s degree or higher.

By race/ethnicity, U.S. Census Bureau data also show that:

  • In Texas, Hispanics are the least likely to have a bachelor’s degree. Only 16 percent of Hispanics age 25 and older have a bachelor’s degree or higher, compared with 41 percent of Non-Hispanic Whites.
  • The percentage of African-Americans in Texas who have a bachelor’s degree is 11 percentage points lower than that of Whites. This gap has decreased by 4 percentage points since 2017.
  • Among the six largest states, Texas is tied for third in the percentage of Whites with a degree and ties for last for Hispanics.

Population Age 25 and Older with a Bachelor’s Degree or Higher (2018)
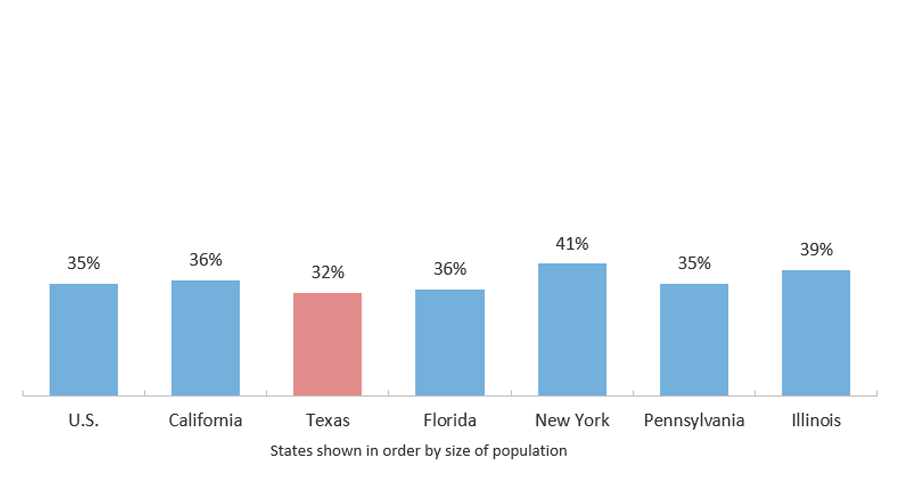
Population Age 25 and Older with a Bachelor's Degree or Higher (2018)

Population Age 25 and Older with a Bachelor’s Degree or Higher by Race/Ethnicity (2018)
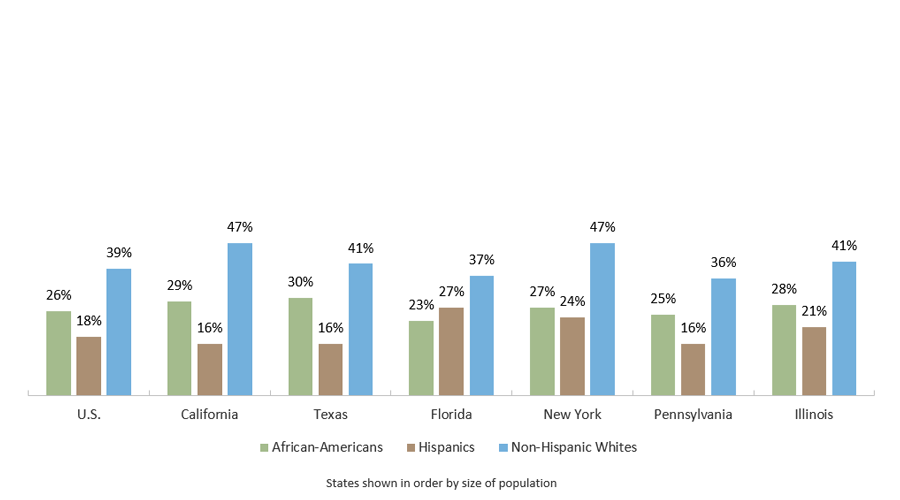
Population Age 25 and Older with a Bachelor's Degree or Higher by Race/Ethnicity (2018)

Sources: U.S. Census Bureau, Current Population Survey 2018. Current Population Survey (CPS) Table Creator For the Annual Social and Economic Supplement (https://www.census.gov/cps/data/cpstablecreator.html).

Bachelor’s Degree Attainment Varies by Texas Region

Bachelor’s degree attainment in the different regions of Texas vary dramatically. In the Metroplex region, 35 percent of people age 25 and older have a bachelor’s degree or higher. In Central Texas, home to the state’s two flagship universities, 34 percent of adults have a bachelor’s degree or higher, and in the Gulf Coast region, 31 percent have a bachelor’s degree or higher. However, educational attainment levels drop off in other areas of the state. The West Texas and Panhandle regions record lower levels of educational attainment, and in the Rio Grande Valley and East Texas regions, the percentage of college graduates with at least a bachelor’s degree is about half that in the Metroplex region.

Population Age 25 and Older with a Bachelor’s Degree or Higher (2020)
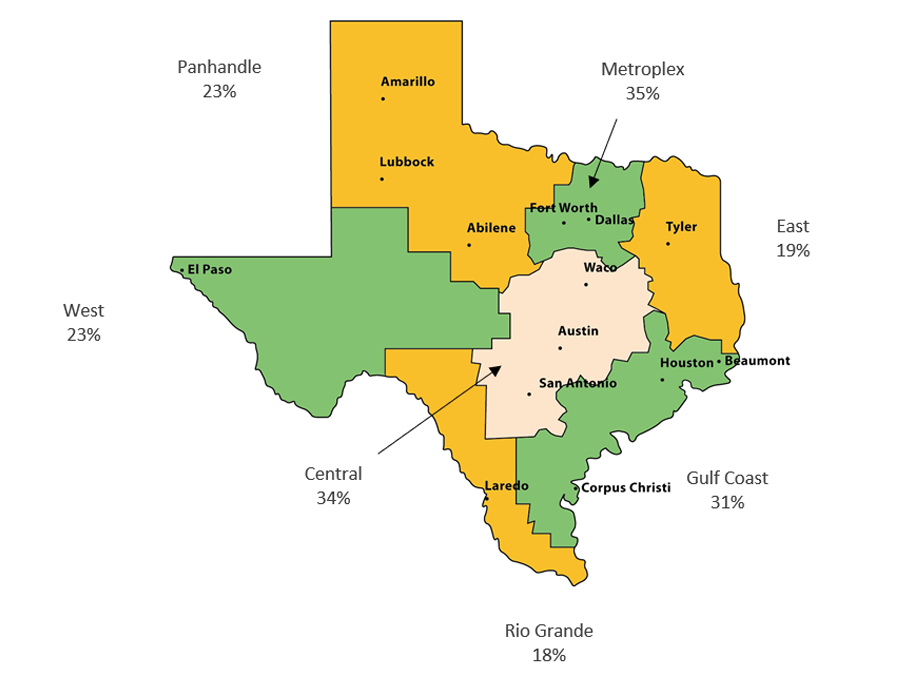
Population Age 25 and Older with a Bachelor’s Degree or Higher (2020)

Sources: U.S. Census Bureau, American Communities Survey, 2020 Five-Year Estimates, Washington, D.C. (http://www.census.gov/acs/www/).

Graduation Rates in Texas Rising, But Remain Stratified by Race/Ethnicity

College graduation rates in Texas are rising but remain stratified by ethnicity. About 66 percent of first-time (in college), full-time freshmen who entered a Texas public university in 2015 obtained a bachelor’s degree from that or another Texas public university within six years, but the rate varied from 74 percent of Whites to 60 percent of Hispanics to 51 percent of African-Americans. The six–year graduation rates have risen over the past two decades for all racial and ethnic groups.

First-time Freshmen Who Entered a Texas Public University and Received a Bachelor’s Degree within Six Years, by Ethnicity
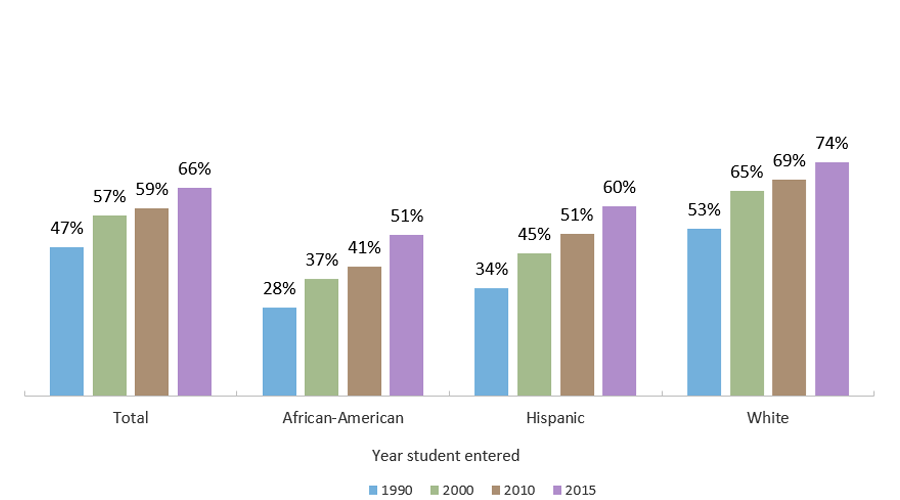
First-time Freshmen Who Entered a Texas Public University and Received a Bachelor's Degree within Six Years, by Ethnicity

Sources: Graduation rates: Six-year: THECB, Baccalaureate Graduation Rates (http://www.txhigheredaccountability.org/AcctPublic/InteractiveReport/Predefined).

Texas Undergraduates Who Took Developmental Education Courses Were Less Likely to Graduate

Texas students who took one or more developmental education courses were less likely to have graduated compared to their peers who did not take developmental education courses at both public four-year and public two-year institutions. In the public four-year sector, developmental education students were a little more likely to still be enrolled six years after entering postsecondary education whereas the opposite was true in the public two-year sector three years after starting college.

In recent years, there have been efforts at institution and state levels to reform developmental education to make it more effective, efficient, and improve the pathways to graduation. Some of the efforts that have shown promise include collaboration with high schools to better assess students before the enter college, compressing the coursework so that it does not take an entire semester to complete the course, using co-requisite pathways that integrate additional support into “mainstream” classes for the students who need it, and implementing comprehensive student support programs.

Percentage of First-Time, Full-Time Texas Undergraduates Who Graduated or Are Still Enrolled, by Sector and Developmental Education Status
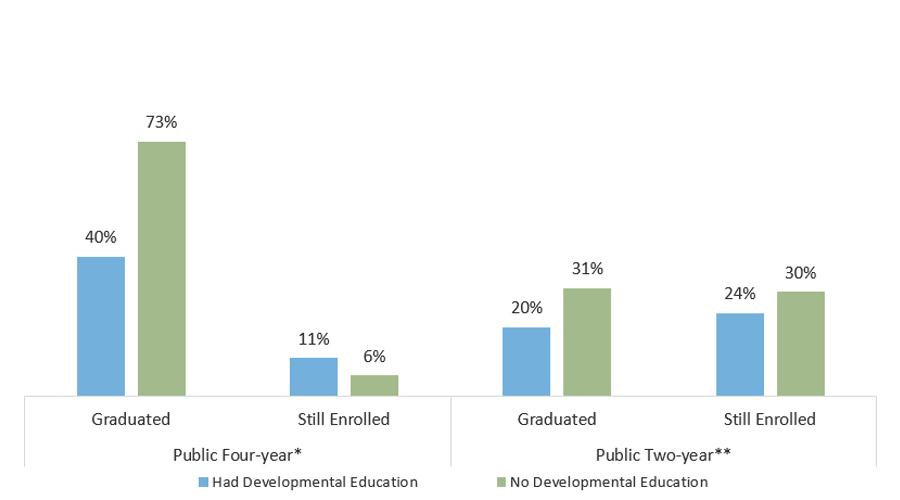
Percentage of First-Time, Full-Time Texas Undergraduates Who Graduated or Are Still Enrolled, by Sector and Developmental Education Status

* In 2021 for first-time, full-time students entering in fall 2015. The missing percentage is the percentage of students who had not graduated or were not still enrolled six years after entering postsecondary education.
** In 2021 for first-time, full-time students entering in fall 2018. The missing percentage is the percentage of students who had not graduated or were not still enrolled three years after entering postsecondary education.
Sources: Texas Higher Education Coordinating Board (THECB), Graduation and Persistence of Developmental Education Students (http://www.txhighereddata.org/index.cfm?objectId=200A40A0-E156-11E8-BB650050560100A9); Developmental Education Reforms: U.S. Department of Education, January 2017, “Developmental Education Challenges and Strategies for Reform” (https://www2.ed.gov/about/offices/list/opepd/education-strategies.pdf).

Texas Ranks Low in Percentage of Young Adults with a Bachelor’s Degree or Higher

The U.S. is often compared to other countries in the Organization for Economic Co-operation and Development (OECD) when measuring educational attainment. However, within the United States, each individual state can have very different education outcomes. Disaggregating attainment by individual U.S. states highlights the variance between state education systems in attainment percentages. The U.S. average for adults (ages 25-64) with a bachelor’s degree or higher is 39 percent, higher than the OECD average and the Texas average of 32 percent. These rankings can change significantly when comparing attainment levels of an associate degree or higher.

Percentage of Adults in 2021 (Ages 25-64) With a Bachelor’s Degree or Higher

Percentage of Adults in 2021 (Ages 25-64) With a Bachelor’s Degree or Higher
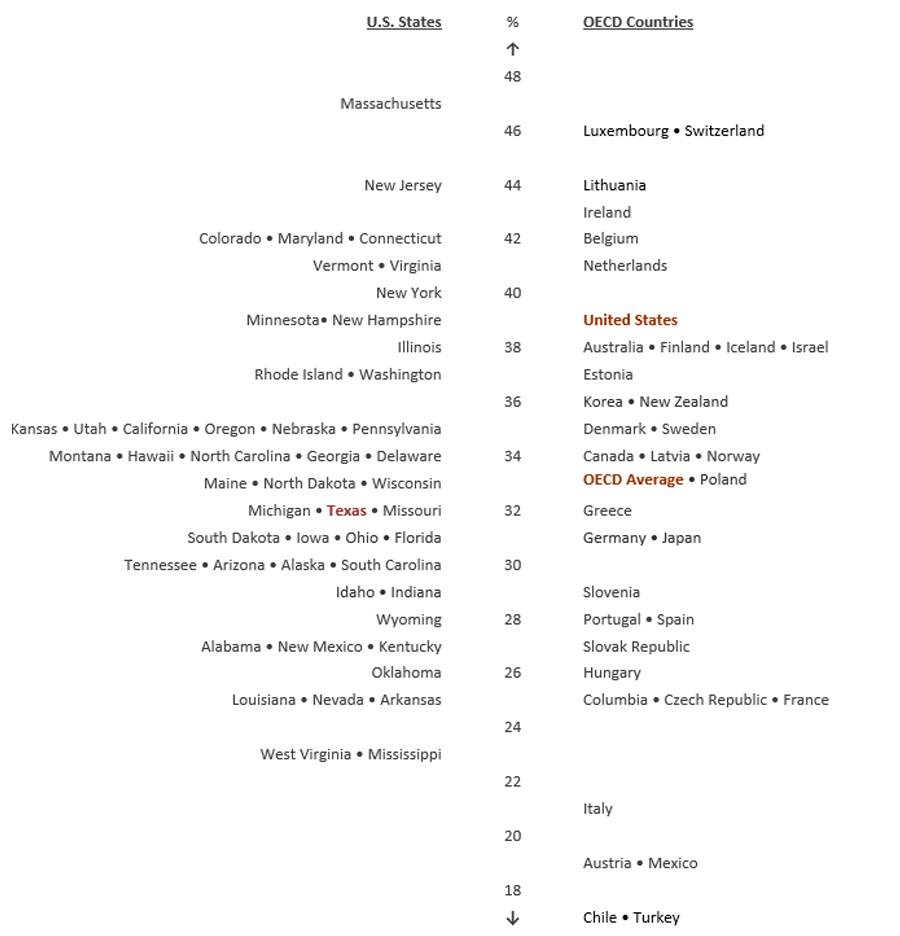
Note: The methodology and design for this figure was derived from the Texas Business Leadership Council and NCHEMS, 2013 TAB Higher Education Summit.
Sources: OECD (2021), Education at a Glance 2021: OECD Indicators, OECD Publishing, Paris.
DOI: http://www.oecd.org/education/education-at-a-glance/; U.S. Census Bureau, Current Population Survey 2020. Current Population Survey (CPS) Table Creator For the Annual Social and Economic Supplement (http://www.census.gov/hhes/www/cpstc/cps_table_creator.html).


Many Texas Students Exit the Education Pipeline Toward a Higher Education Degree or Certificate at Transition Points

The student pipeline is one way to consider the flow of Texas students into postsecondary credentials. The pipleine metaphor highlights the major transition points, or “leaks”, where many students drip out of the system. Focusing only on student success after high school is an insufficient strategy to increase the number of postsecondary credentials. Instead, a strategy of promoting student achievement at every level of the educational pipeline has a better chance of increasing degree attainment.

At every stage of the student pipeline, larger percentages of Hispanic and African-American students exited compared to White students. Whereas 60 percent of White 8th graders in 2009 enrolled in higher education directly following high school graduation, only 53 and 46 percent of African American and Hispanic 8th graders enrolled, respectively. Reducing these disparities is essential to making the attainment gains Texas needs for a skilled and competitive workforce, because these gains will most easily be found in historically underserved populations. For all student groups, those who enrolled in higher education but did not complete a degree or certificate represented the largest drop-off in the student education pipeline and the largest opportunity to improve student success.

Texas Student Pipeline by Race/Ethnicity, Transition Rates from 8th Grade to College Completion
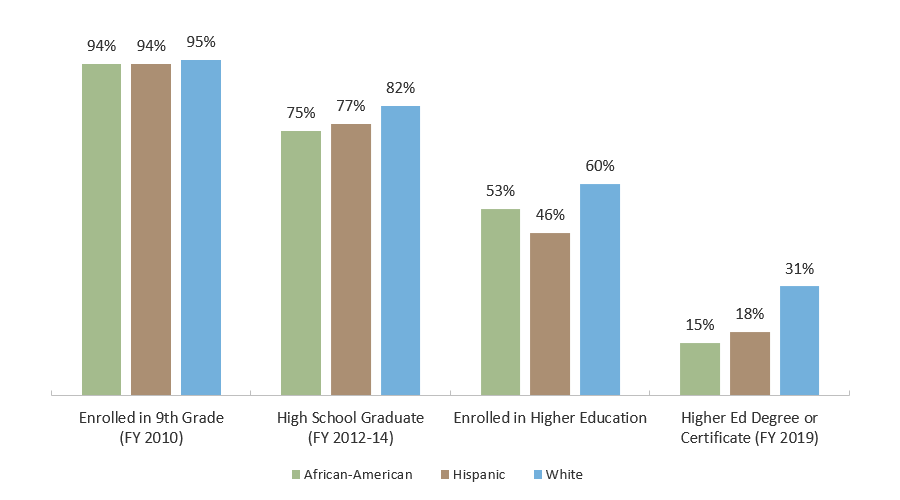
Texas Student Pipeline by Race/Ethnicity Transition Rates from 8th Grade to College Completion

Note: The methodology and design for this figure was derived from the Texas Business Leadership Council and NCHEMS, 2013 TAB Higher Education Summit.
Sources: Texas Higher Education Coordinating Board, Regional Topic Data Tabs: 8th Grade Cohort and HS to College Data, 2019 (http://www.txhighereddata.org/index.cfm?objectId=4E600400-D970-11E8-BB650050560100A9). TEA and National Student Clearinghouse data used by THECB. Out-of-state graduate total not shown, because current NSC data collection extends only into 2006.

More Than 40 Percent of Low-Income Students Nationwide Dropped Out Within Six Years of Starting College

Income plays an outsized role in student success. The federal government tracked first-year students who began in academic year (AY) 2011-12. These students were segmented into income quartiles and compared by their academic outcomes. Over half of the top quartile earned a bachelor’s degree within six years, while only 22 percent of the lowest quartile had made such an achievement. Furthermore, students in the bottom income quartile were almost twice as likely to leave school without a degree as those in the top quartile.

Six-year Attainment Status of 2011-12 First-year Students by Income Quartile
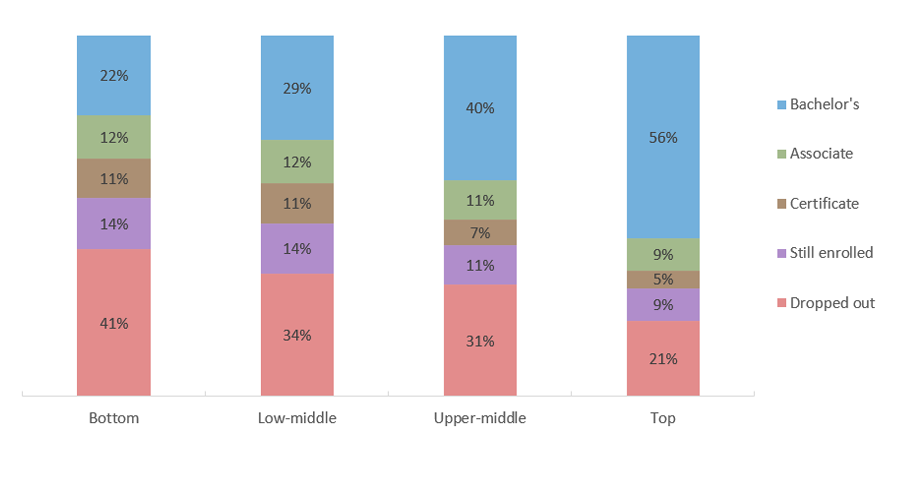
Six-year Attainment Status of 2011-12 First-year Students by Income Quartile

Sources: U.S. Department of Education, National Center for Education Statistics, 2012/2017 Beginning Postsecondary Students Longitudinal Survey (BPS: 12/17) (https://nces.ed.gov/surveys/bps/).

Low-Income Texas Students Are Far Less Likely to Obtain Bachelor’s Degree Than High-Income Peers

Less than a third of Texas baccalaureate students with incomes below $35,000 had graduated within six years, compared to two-thirds of students with six-digit incomes. Students with low incomes are more likely to have unmet need, which is the amount that students and/or their families must cover over and above all grants, scholarships, work-study, loans, and expected family contribution*.

Baccalaureate Graduation Status by 2015 Income, 2013-14 Texas Public High School Graduates Enrolled in Fall 2014 in Texas Higher Education
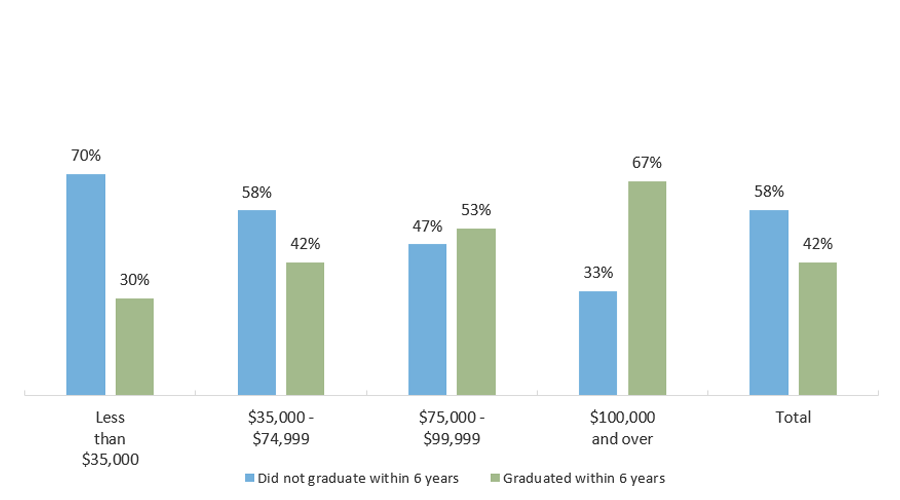
Baccalaureate Graduation Status by 2015 Income, 2013-14 Texas Public High School Graduates Enrolled in Fall 2014 in Texas Higher Education

* Expected family contribution is determined through a federal formula that considers family size, income, and the number of children in college, among other factors. It is considered a rough estimate of a reasonable, affordable annual payment for a family with a given set of circumstances.
Sources: Texas Higher Education Coordinating Board (THECB), “Baccalaureate Graduation Status within Six Years by Income Range” (unpublished tables; special request).

Four in Five African-American Texas Bachelor’s Degree Graduates Had Borrowed Student Loans

Bachelor’s degree recipients in Texas who graduated in fiscal year (FY) 2020 were more likely to borrow and borrowed larger cumulative amounts compared to Certificate and Associate degree recipients. African-American students were particularly likely to borrow and to have a larger cumulative amount compared to students of other races/ethnicities, with 79 percent of African-American Bachelor’s degree recipients borrowing a median of nearly $40,000.

Percentage of Texas Graduates with Student Loans, by Degree Level and Race/Ethnicity (FY 2020 Graduates)
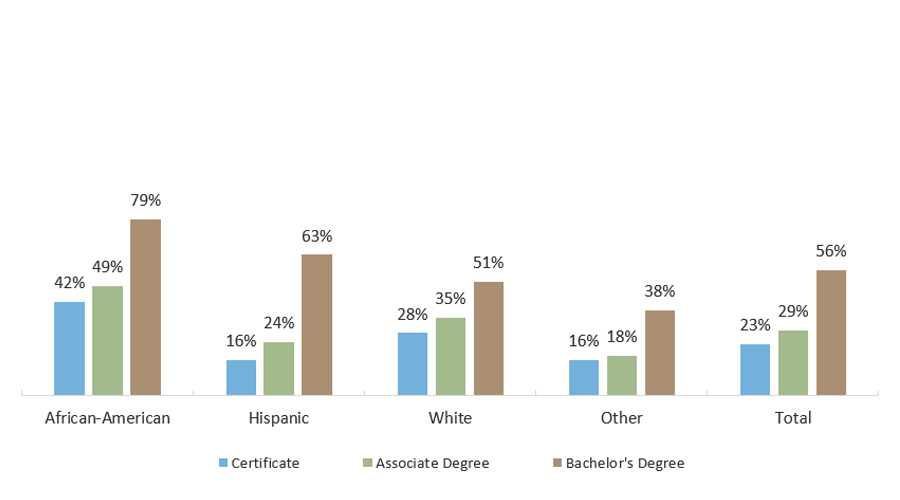
Percentage of Texas Graduates with Student Loans, by Degree Level and Race/Ethnicity (FY 2020 Graduates)

Median Loan Amount For Texas Graduates with Student Loans, by Degree Level and Race/Ethnicity (FY 2020 Graduates)
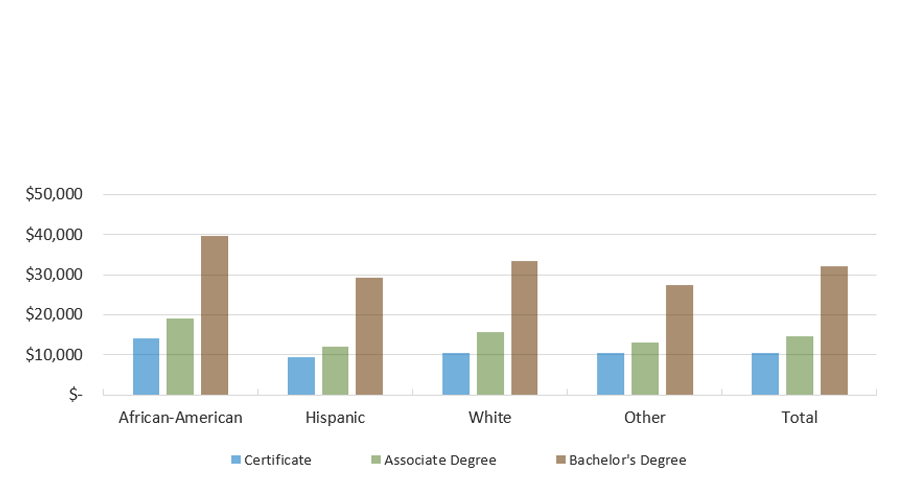
Median Loan Amount For Texas Graduates with Student Loans, by Degree Level and Race/Ethnicity (FY 2020 Graduates)

Sources: Texas Higher Education Coordinating Board (THECB), “Median Indebtedness by Degree Level and Race/Ethnicity” (unpublished tables; special request).

HBCU Bachelor’s Degree Recipients Borrowed a Median Cumulative Amount of Over $43,000

Student borrowers graduating with a bachelor’s degree at Texas Historically Black Colleges and Universities (HBCUs) had a median debt of more than $43,000 or almost one-third higher than their peers attending all other institutions in Texas.* The median amount borrowed at the Certificate and Associate Degree level is more similar between the HBCUs, the Hispanic-Serving Institutions (HSIs), and the non-HBCU/HSI institutions.

Median Loan Amount for Texas Graduates with Student Loans, by Degree Level and School Group (FY 2020 Graduates)
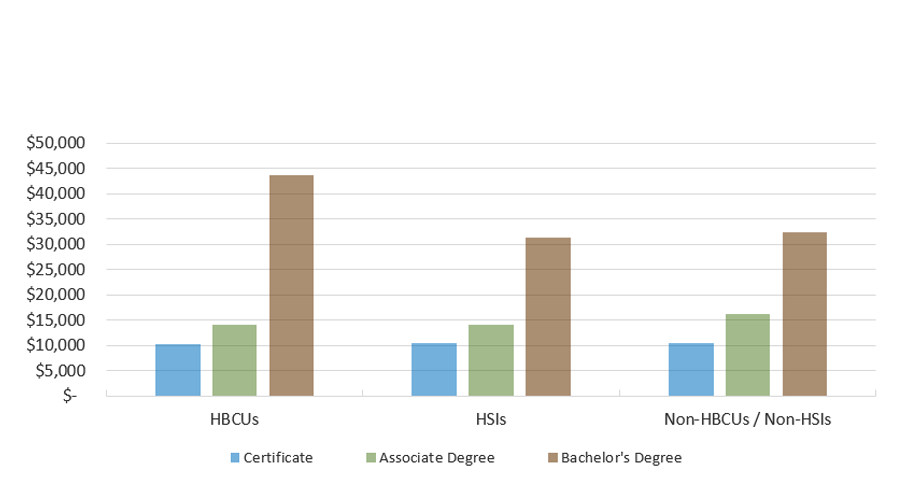
Median Loan Amount for Texas Graduates with Student Loans, by Degree Level and School Group (FY 2020 Graduates)

*Excluding private, for-profit institutions
Sources: Texas Higher Education Coordinating Board (THECB), “Median Indebtedness by Degree Level and School Group” (unpublished tables; special request).

Share This Page!