State of Student Aid in Texas – 2021
Default Rates Decrease for Texas and the Nation
Texas, National Three-year Cohort Default Rates* (FY 2010–2017)
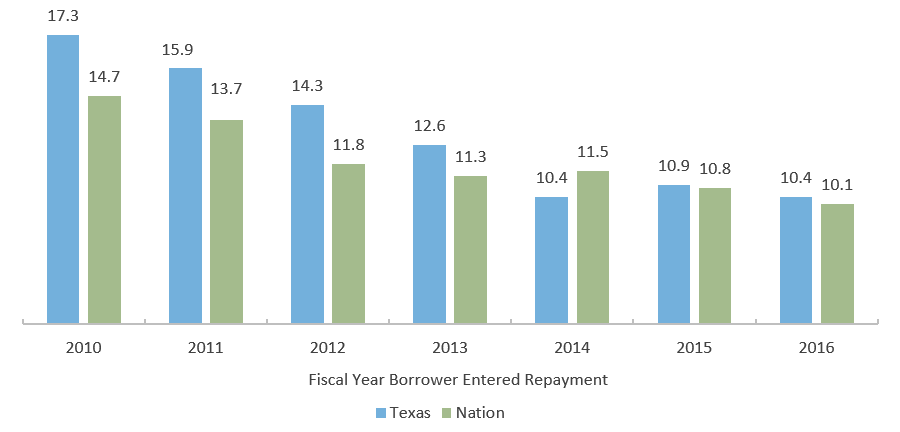
*A three-year cohort default rate is the percentage of student borrowers with loans entering repayment in a given fiscal year who default on their obligations during that given fiscal year or in the next two fiscal years that follow. The FY 2017 cohort default rate, for example, is based on student borrowers who entered repayment during FY 2017 and subsequently defaulted by the end of FY 2019.
Sources: U.S. Department of Education, Fiscal Year Three-Year Official Cohort Default Rates, Washington, D.C., 2020.
Texas Three-Year Cohort Default Rates Vary by Region
Three-year Cohort Default Rates* (FY 2017)
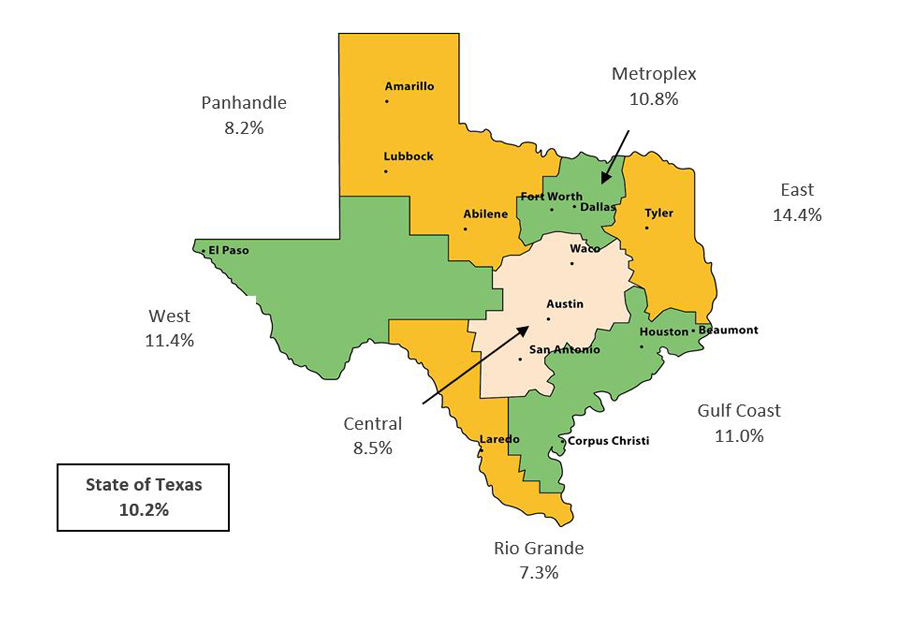
*A three-year cohort default rate is the percentage of student borrowers with loans entering repayment in a given fiscal year who default on their obligations during that given fiscal year or in the next two fiscal years that follow. For example, the FY 2017 cohort default rate is based on student borrowers who entered repayment during FY 2017 and subsequently defaulted by the end of FY 2019.
Sources: U.S. Department of Education, Fiscal Year 2016 and Fiscal Year 2017 Three-Year Official Cohort Default Rates, Washington, D.C., 2020.
Short-Term Programs Have Higher Three-Year Default Rates
Texas Three-year Cohort Default Rates* by School Type, FY 2017 Cohort
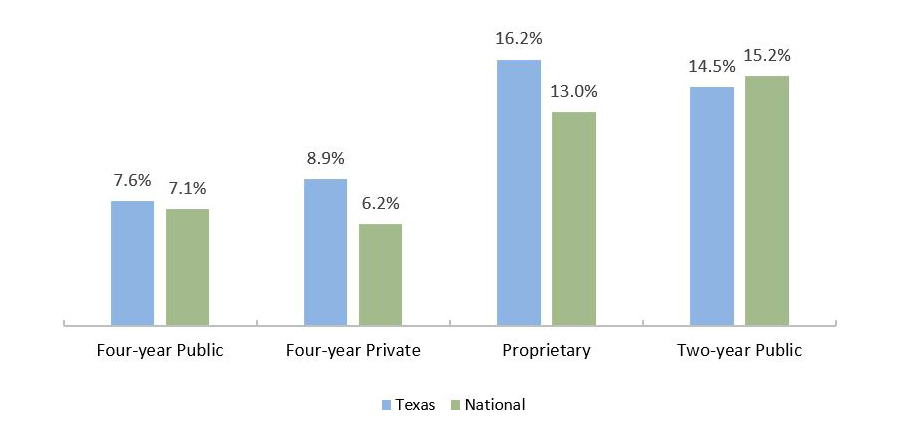
*A three-year cohort default rate is the percentage of student borrowers with loans entering repayment in a given fiscal year who default on their obligations during that given fiscal year or in the next two fiscal years that follow. The FY 2017 cohort default rate, for example, is based on student borrowers who entered repayment during FY 2017 and subsequently defaulted by the end of FY 2019.
Sources: Cohort Default Rates: U.S. Department of Education, Fiscal Year 2017 Official Cohort Default Rates, Washington, D.C., 2020; Proprietary School Program Length: U.S. Department of Education, National Center for Education Statistics, Integrated Postsecondary Education Data System (IPEDS) 2020 (http://nces.ed.gov/ipeds); All Other: U.S. Department of Education, National Center for Education Statistics, “National Postsecondary Student Aid Study (NPSAS) 2016” (http://www.nces.ed.gov/das/).
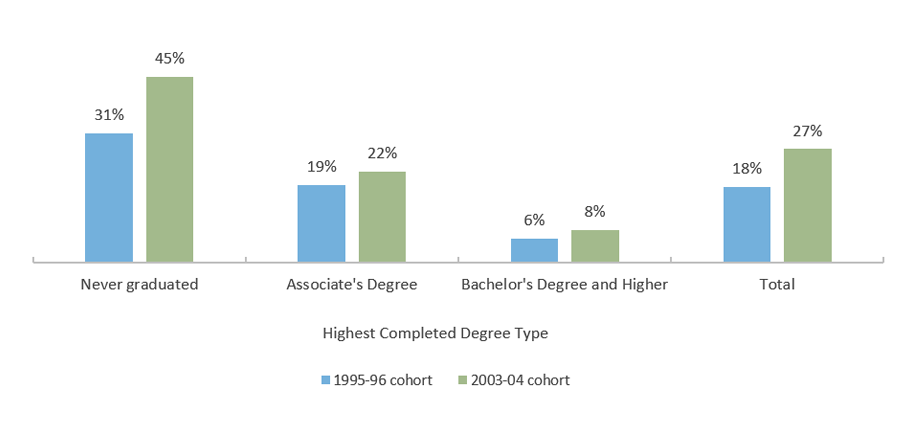
Nearly Half of Borrowers Who Did Not Graduate Had Defaulted within 12 Years of Starting College
Percentage of Borrowers Who Defaulted within 12 Years of Starting College, by Degree Type, 1995-96 and 2003-04 Cohorts
Sources: Default Rates: U.S. Department of Education, National Center for Education Statistics, Repayment of Student Loans as of 2015 Among 1995-96 and 2003-04 First-Time Beginning Students, October 2017 (https://nces.ed.gov/pubsearch/pubsinfo.asp?pubid=2018410); Risk Factors: U.S. Department of Education, National Center for Education Statistics, “National Postsecondary Student Aid Study (NPSAS) 2012” (http://www.nces.ed.gov/das/); Unemployment Rates: Bureau of Labor Statistics. “Employment Status of the Civilian Population 25 Years and Over by Educational Attainment,” March 2018 (https://www.bls.gov/news.release/empsit.t04.htm).
One-Fifth of Texas Borrowers Had Not Reduced Their Principal Balance After Five Years in Repayment
| Repayment Group | Percent of Borrowers | Repayment Subgroup | Percent of Borrowers |
|---|---|---|---|
| Defaulters | 24% | Paused Any Payment | 14% |
| Missed Any Payment | 10% | ||
| Balance Increasers | 21% | N/A | N/A |
| Balance Decreasers | 45% | Uninterrupted | 22% |
| Paused Any Payment | 20% | ||
| Missed Any Payment | 3% | ||
| Consolidators | 10% | N/A | N/A |
Sources: The Pew Charitable Trusts, Student Loan System Presents Repayment Challenges, November 2019 (https://www.pewtrusts.org/-/media/assets/2019/11/psbs_report.pdf).
Most Defaulters Who Did Not Pause Payments Defaulted Very Quickly
Timing of Default by Type of Defaulter
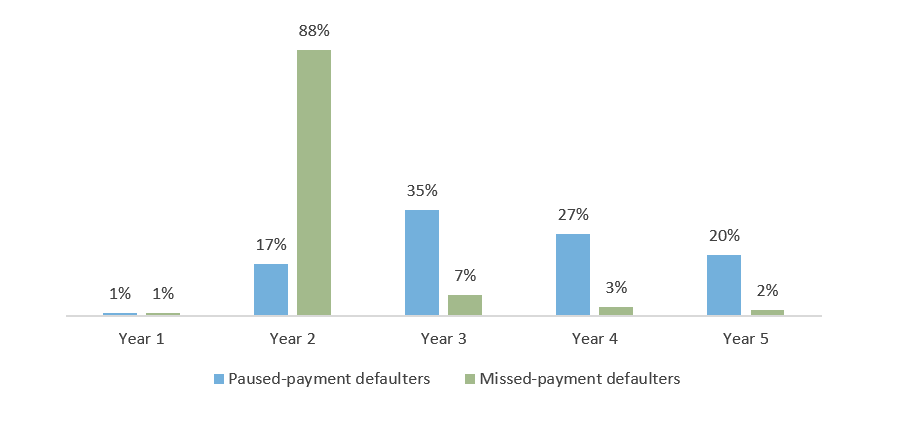
*In Trellis’ administrative database of Family Federal Education Loan Program loans, borrowers are considered to be in default when the servicer has filed a claim against them, which can occur at any point between 270 and 360 days of nonpayment.
Note: This analysis calculated years to default from the end of borrowers’ six-month grace periods.
Sources: The Pew Charitable Trusts, Student Loan System Presents Repayment Challenges, November 2019 (https://www.pewtrusts.org/-/media/assets/2019/11/psbs_report.pdf).
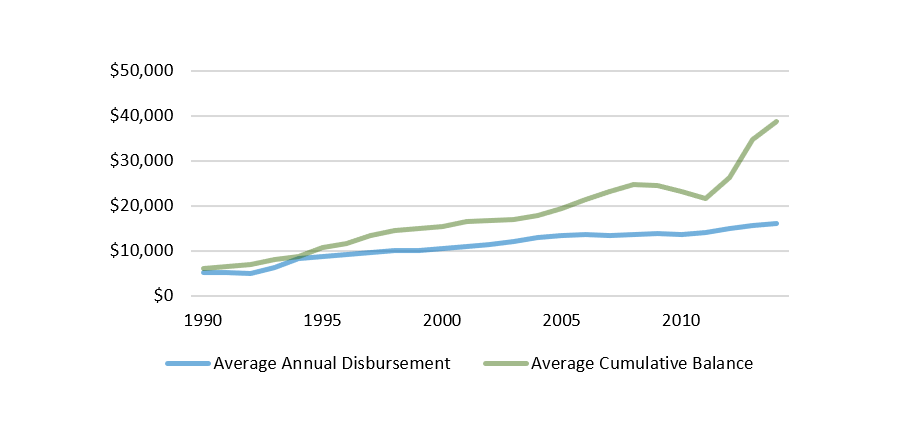
Parents Struggle to Repay as Parent PLUS Borrowing Increases
Average Parent PLUS Borrowing, 1990 to 2014, In 2014 Dollars
| Repayment Category | Percent | |
|---|---|---|
| Successfully Repaying | Uninterrupted Payments | 45% |
| Had Deferment, Forbearance, and/or Delinquency | 23% | |
| Had Delinquency Only | 7% | |
| Default | Had Deferment, Forbearance, and/or Delinquency | 5% |
| Had Delinquency Only | 3% | |
| No Reduction in Principal Balance | 7% | |
| Consolidation | 12% | |
