State of Student Aid in Texas – 2022

Texas Undergraduates More Likely to Attend Two-Year Institutions Than U.S. Undergraduates

Half of Texas undergraduates attended public two-year institutions in the fall of 2020, far higher than the percentage of undergraduates nationwide in that sector. Texas undergraduates were less likely to be enrolled at private four-year or proprietary institutions compared to undergraduates nationwide, and slightly less likely to be enrolled at public four-year institutions.

While its relative low cost helps create access to postsecondary education opportunities, students who enroll at public two-year institutions are more likely to attend part-time compared to students enrolled in other sectors. Part-time students are at a greater risk of dropping out compared to those attending full-time, which is one of the factors that reduces the odds of Texas undergraduates earning their intended degrees.

Undergraduate Enrollment by Location and Sector (Fall 2020)
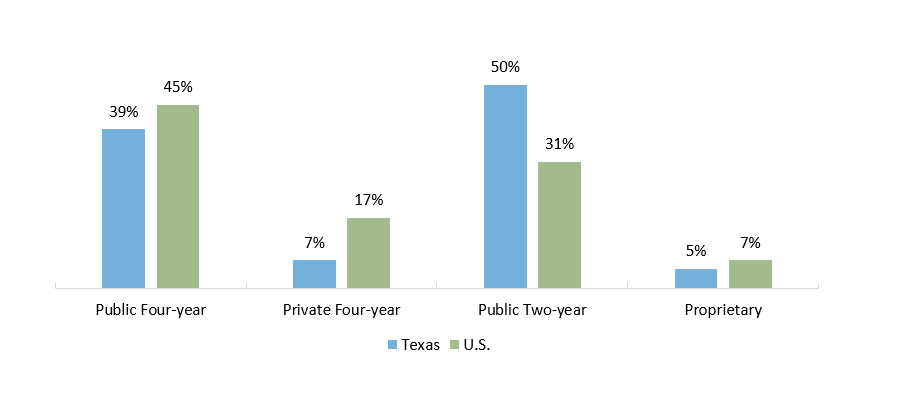
Undergraduate Enrollment by Location and Sector (Fall 2020)

Source: U.S. Department of Education, National Center for Education Statistics, Integrated Postsecondary Education Data System (IPEDS) 2020 (http://nces.ed.gov/ipeds/).

Nearly Half of Undergraduates in Texas Enroll in School Part Time

Part-time enrollment is more common in Texas than in the nation as a whole and within Texas much more prevalent at community colleges. As of fall 2020, about 46 percent of undergraduates in Texas were classified as full-time students. At public two-year colleges, the largest sector by enrollment, less than a third of students attend full-time. Reasons for part-time enrollment vary but may pertain to financial or personal concerns, like having limited funds for school expenses, trying to avoid student loans, caregiving responsibilities, or working more hours to provide for oneself and/or family. For several reasons, students who attend part-time are more likely to drop out of school.

Enrollment Intensity of Undergraduates in Texas and the U.S. (Fall 2020)
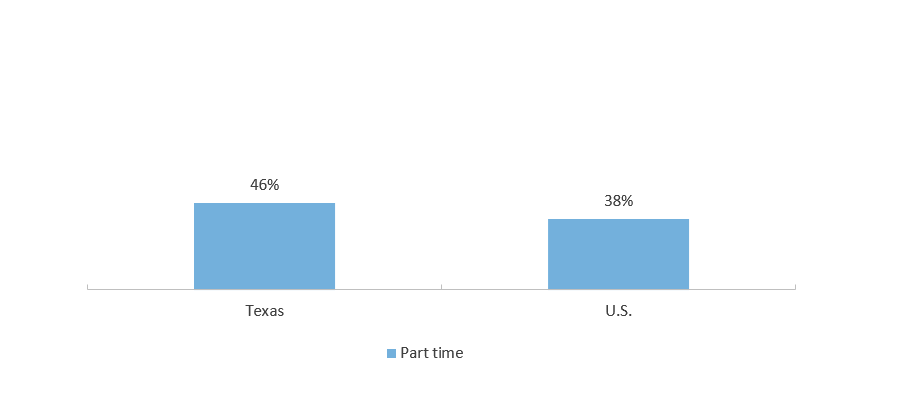
Enrollment Intensity of Undergraduates in Texas and the U.S. (Fall 2020)

Enrollment Intensity of Undergraduates in Texas by School Sector (Fall 2020)
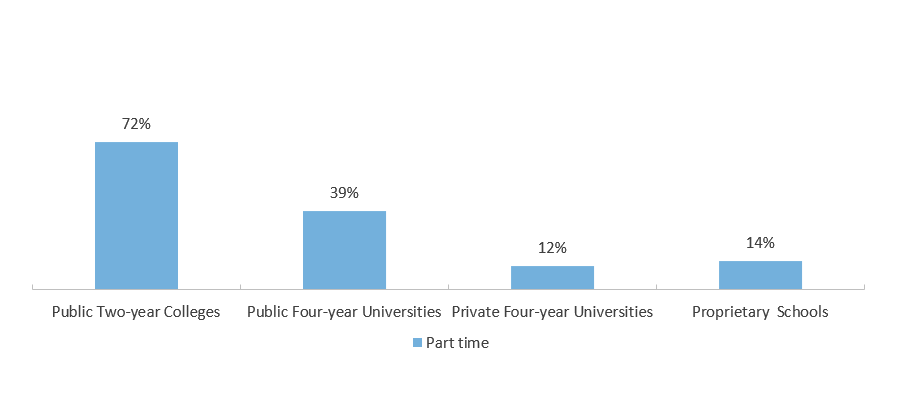
Enrollment Intensity of Undergraduates in Texas by School Sector (Fall 2020)

Note: Institutions report their enrollment data to the Department of Education. The data are compiled but not de-duplicated at a student level, therefore some students may be concurrently enrolled at multiple institutions which may increase the proportion of students enrolled part-time.
Source: U.S. Department of Education, National Center for Education Statistics, Integrated Postsecondary Education Data System (IPEDS) 2020 (http://nces.ed.gov/ipeds/).


Most First-Year Undergraduates in Texas Attend Two-Year Institutions

The number of undergraduates at public two-year institutions in Texas is much larger than the number at public four-year institutions and far exceeds the number at private institutions. In fact, 78 percent of all freshmen attending Texas public institutions of higher education in fall 2020 were enrolled at two-year colleges, and only 22 percent were enrolled at four-year universities.

Texas colleges and universities are exceptionally diverse. White students represent about a third or less at three of the sectors and just under half of students in the private four-year sector.

Texas Undergraduates by Race/Ethnicity and Sector (Fall 2020)
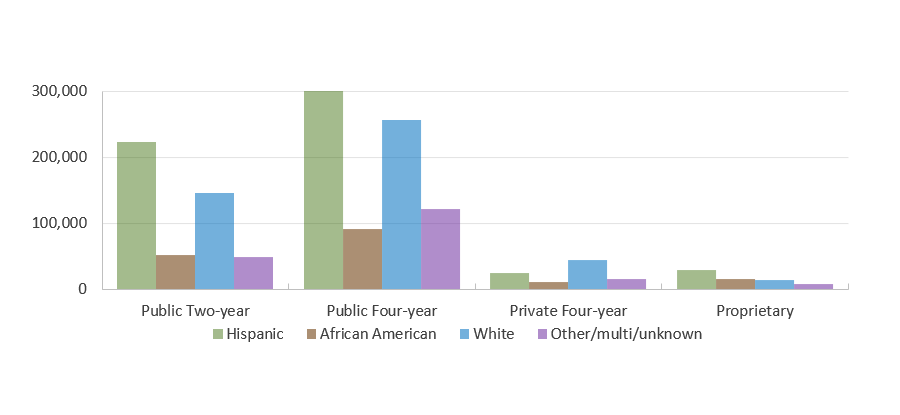
Texas Undergraduates by Race/Ethnicity and Sector (Fall 2020)

Undergraduates by Classification and Sector (Fall 2020)
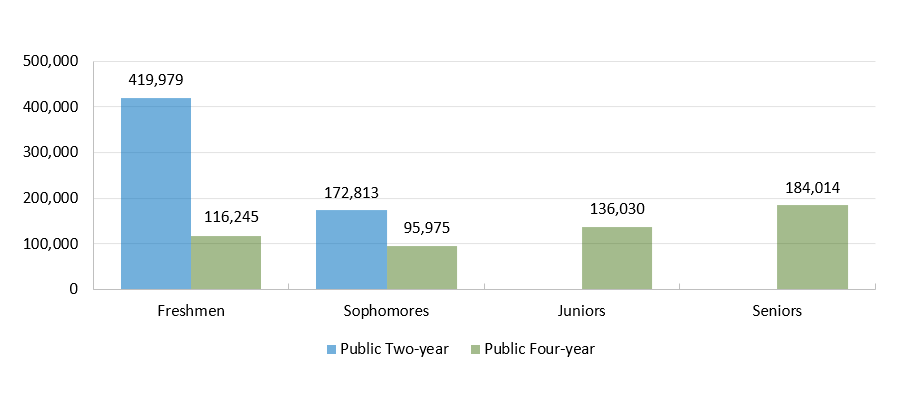
Undergraduates by Classification and Sector (Fall 2020)

Source: Enrollment by classification: Texas Higher Education Coordinating Board (THECB), Texas Higher Education Data, Accountability System Interactive Reports, Enrollment Statewide by Institution Type and Classification (http://www.txhigheredaccountability.org/AcctPublic/InteractiveReport/Accountability). Enrollment by race (fall 2020): U.S. Department of Education, National Center for Education Statistics, Integrated Postsecondary Education Data System (IPEDS) 2020 (http://nces.ed.gov/ipeds/).

Older Students Gravitate to Community Colleges and Proprietary Schools

Of all Texas undergraduates in fall 2020, 79 percent were under age 25, nine percent were between age 25 and 29, and 12 percent were age 30 or older. The pattern in the U.S. is similar.

Older students are more common at community colleges and proprietary schools. These students often balance work and school, and have family obligations that compete with academic responsibilities. The educational experience of older students can be much different than their younger peers.

Age of Undergraduates in Texas and the U.S. (Fall 2020)
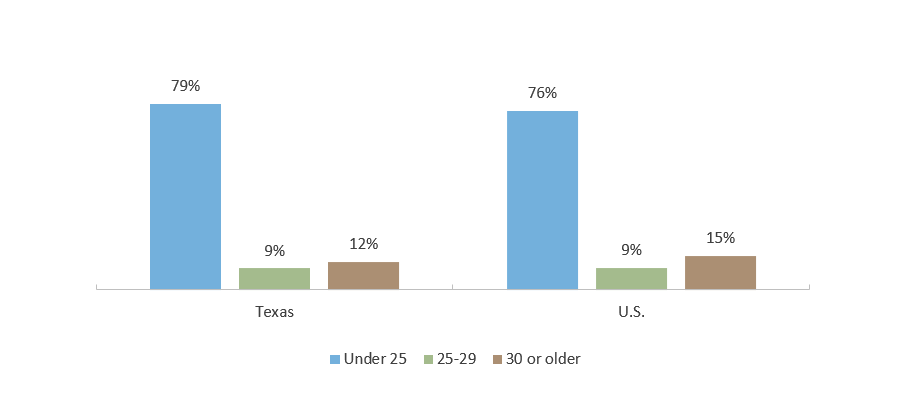
Age of Undergraduates in Texas and the U.S. (Fall 2020)

Age of Undergraduates in Texas by School Sector (Fall 2020)
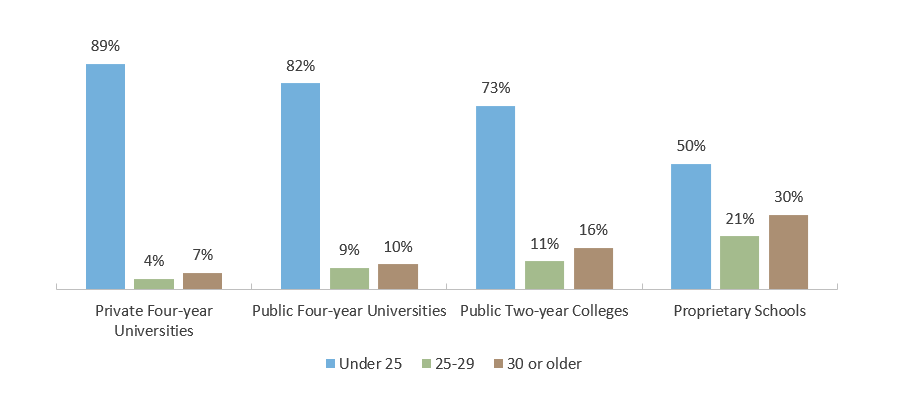
Age of Undergraduates in Texas by School Sector (Fall 2020)

Source: U.S. Department of Education, National Center for Education Statistics, Integrated Postsecondary Education Data System (IPEDS) 2020 (http://nces.ed.gov/ipeds/).

Greater Percentages of Postsecondary Students Live Below the Poverty Line and Require More Financial Aid

Students at or below the poverty level increased from 16 percent in AY 1999-2000 to 26 percent in AY 2015-2016. These students will have greater need for student financial aid and will display heightened price sensitivity. Concurrently, students in the highest income category – greater than 300 percent of the poverty line – have become rarer, declining from 46 percent in 1999-2000 to 35 percent in 2015-2016. Wealthier students tend to be more able to withstand tuition increases.

Federal U.S. Department of Health and Human Services poverty guidelines were used along with family size and income to determine the percent. For dependent students, the family size and income of their parents are used. For independent students, the family size and income of that student is used. Students in Alaska and Hawaii had their rates calculated using different, state-specific, poverty guidelines.

U.S. Postsecondary Students by Income as Percent of Poverty Line, 2000-2016
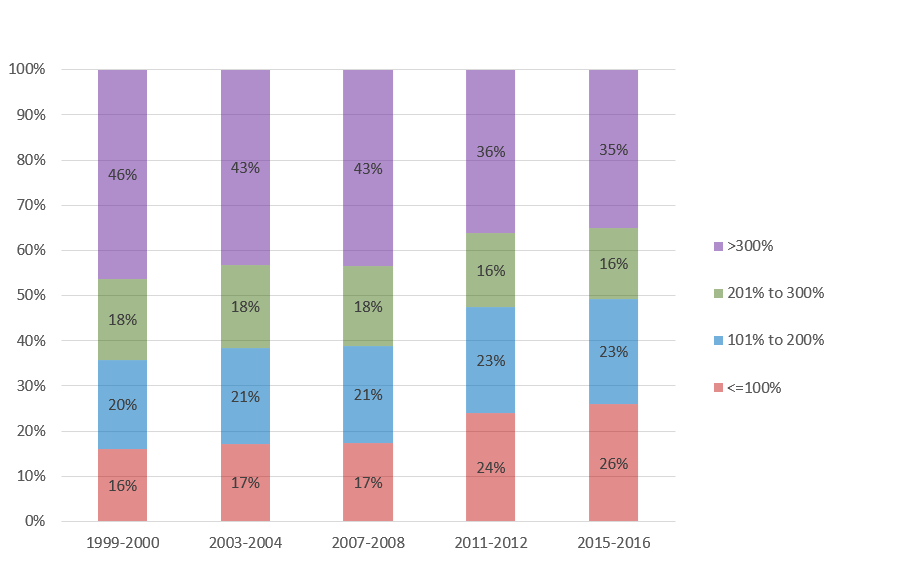
U.S. Postsecondary Students by Income as Percent of Poverty Line, 2000-2016

Source: U.S. Department of Education, National Postsecondary Student Aid Study (NPSAS) (http://www.nces.ed.gov/das), survey years 2000, 2004, 2008, 2012, and 2016.

Over Half of Community College Students in the U.S. Had Taken Developmental Education Courses During College

About a third of all undergraduates in the U.S. who graduated in academic year (AY) 2015-2016 had taken at least one developmental education course while in college. This varied by sector, with about 21 percent of private four-year undergraduates and more than half of students at public two-year institutions having been through developmental education.

Students who attended full time throughout their postsecondary education were the least likely to take developmental education courses compared to students with other attendance intensity patterns. Students are more likely to have taken at least one developmental education course in college as their attendance intensity lessens.

Students who take developmental education courses are less likely to graduate than their peers. In the Texas public four-year sector, students who did not take developmental education courses had double the graduate rate of their developmental education peers six years after entering higher education. The same pattern is seen in the public two-year sector with the non-developmental education students graduating at nearly double the rate of developmental education students three years after entering college.

Percentage of U.S. Students Who Ever Took Developmental Education Courses, by Sector (AY 2015-2016)
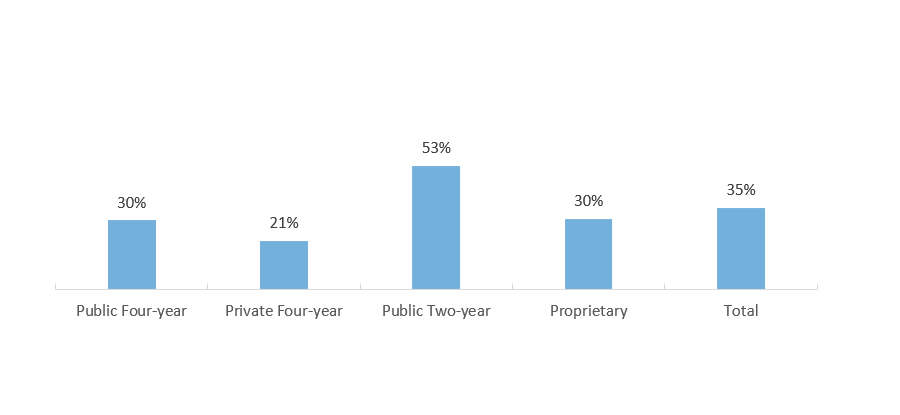
Percentage of U.S. Students Who Ever Took Developmental Education Courses, by Sector (AY 2015-2016)

Percentage of U.S. Students Who Ever Took Developmental Education Courses, by Attendance Intensity (AY 2015-2016)
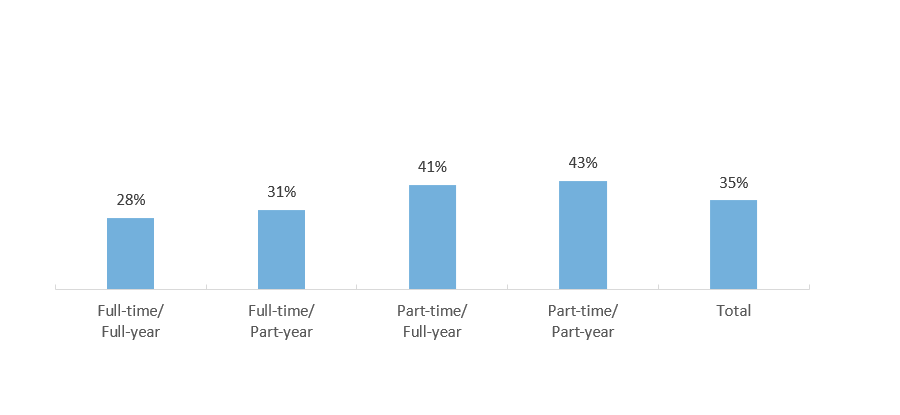
Percentage of U.S. Students Who Ever Took Developmental Education Courses, by Attendance Intensity (AY 2015-2016)

Source: U.S. Department of Education, National Postsecondary Student Aid Study 2016 (NPSAS) (http://www.nces.ed.gov/das); Graduation Rate: Texas Higher Education Coordinating Board (THECB), Graduation and Persistence of Developmental Education Students (http://www.txhighereddata.org/index.cfm?objectId=200A40A0-E156-11E8-BB650050560100A9).

Seventy-Three Percent of Students at Texas Public Universities Were Not in the Top 10 Percent of Their High School Class

While the majority of first-time students at two of Texas’ public flagship universities – the University of Texas at Austin and Texas A&M University – are drawn from the top ten percent of Texas high school classes, the far majority of students at Texas public universities are not. Top ten percent graduates account for about 27 percent of all first-time Texas public university students and only about 12 percent* of first-time students at the non-flagship universities. Non-flagship universities account for about 71 percent of all Texas public university undergraduates.

Two of the 35** non-flagship public universities exceeded the average proportion of the top ten percent students: the University of Houston (30 percent) and the University of Texas at Dallas (29 percent). Four others exceeded 20 percent: Texas A&M International University (21 percent), West Texas A&M University (22 percent), the University of North Texas at Dallas (23 percent), and the University of Texas at Arlington (24 percent).

Six public universities had first-time classes whose share of top ten percent enrollment was less than ten percent.

Percentage of Top 10 Percent Admits Among First-Time Texas Public Four-Year University Students (Fall 2020)
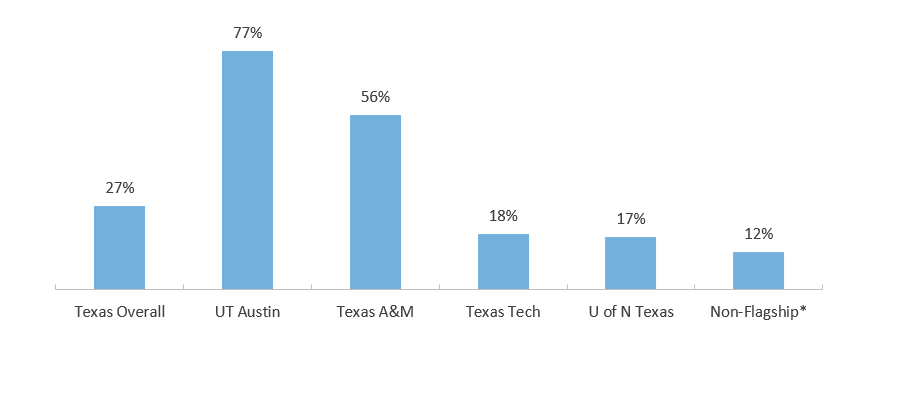
Percentage of Top 10 Percent Admits Among First-Time Texas Public Four-Year University Students (Fall 2020)

*Estimate based on applying the percentage of top ten percent graduates among first-time students to the number of enrolled freshmen-level students.
**This is the number of non-flagship public universities for which the THECB had data on the percentage of top 10 percent enrollments. There are 37 Texas public universities in total.
Source:  Texas Higher Education Coordinating Board (THECB) 2020 Higher Education Almanac (https://www.highered.texas.gov/data-reports/texas-public-higher-education-almanac/).

First-Generation Students’ Proportion of Undergraduate Enrollments Declining

The proportion of U.S. students who are the first in their families to attend college has declined sharply since 2011-12. While first generation students are highly represented in all school sectors, the largest concentration appear at proprietary schools and public two-year colleges.

Percent of U.S. Undergraduate Enrollment that is First Generation,* Nationally by Year
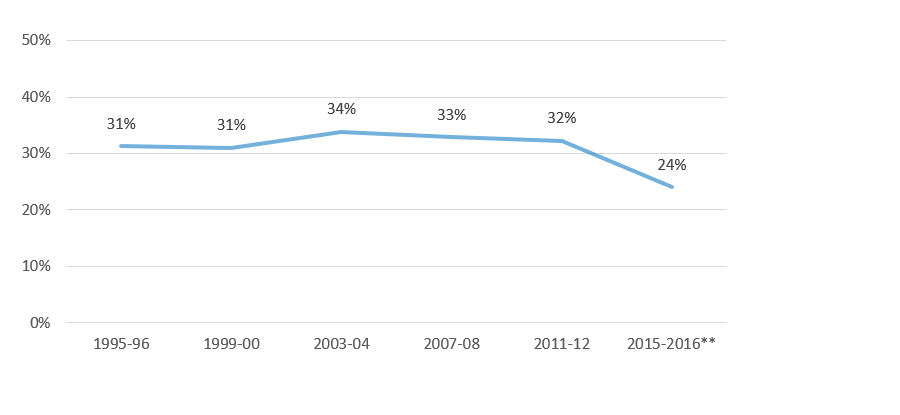
Percent of U.S. Undergraduate Enrollment that is First Generation,* Nationally by Year

Percent of U.S. Undergraduate Enrollment that is First Generation,* Nationally by School Type for Academic Year 2015-16
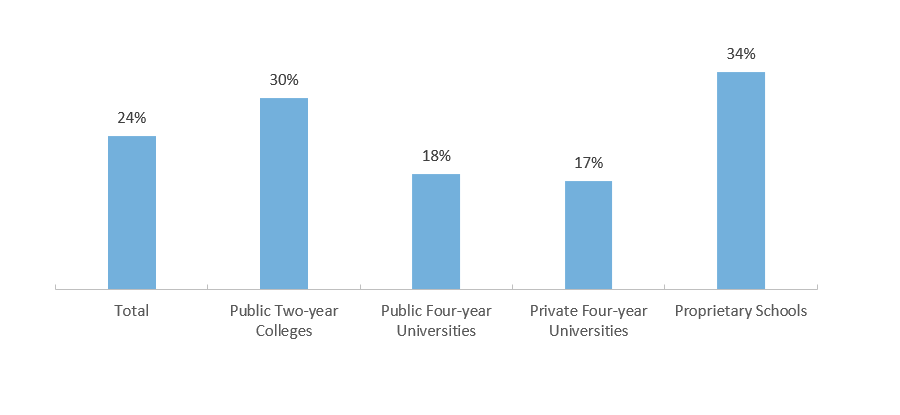
Percent of U.S. Undergraduate Enrollment that is First Generation,* Nationally by School Type for Academic Year 2015-16

* First generation for this purpose is defined as students who have parents with the highest level of education attained by either one as high school or below. This does not include those with parents who attended some college or those who are unsure of their parents’ educational levels.
**A change was made for the 2015-2016 survey that expanded the definition of parent to include step-parents or other adult guardians.
Source:  : U.S. Department of Education, National Postsecondary Student Aid Study (NPSAS) (http://www.nces.ed.gov/das), survey years 1996, 2000, 2004, 2008, 2012, and 2016.

Share This Page!